October 23rd, 2016 •
Comments Off on Low Glycemic Foods list PDF – A Smart Choice For Good Health
Low glycemic foods are a smart choice for good health. Even more so when you suffer from Adrenal Fatigue. Use our low glycemic foods list PDF. Low-glycemic foods cause a steadier rise of blood sugar and the fiber in these foods will help you feel more satisfied between meals.
Blood Sugar
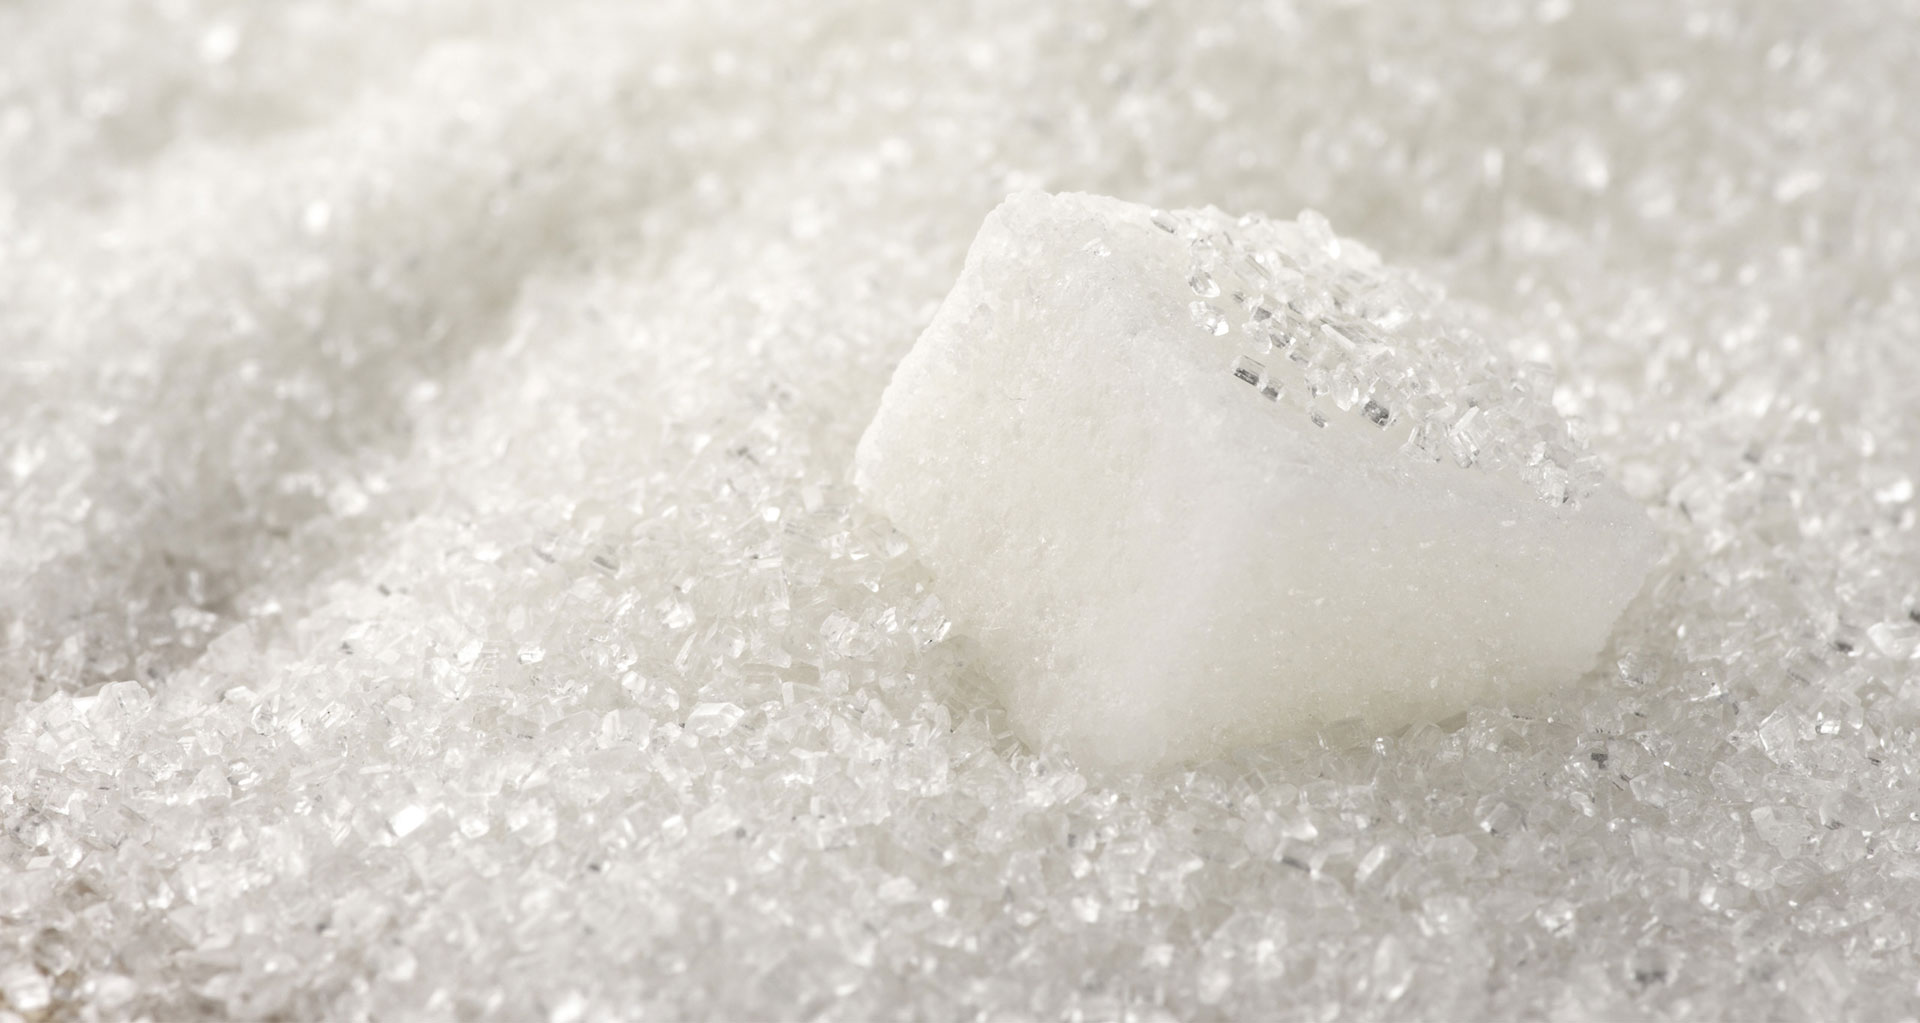
Blood sugar, or glucose, is a key source of energy and provides nutrients to your body’s organs, muscles and nervous system. During the digestion of food, your body breaks down digestible carbohydrates to sugar before absorbing and using them for energy. Carbohydrates can be either “simple” or “complex”. Simple carbohydrates are composed of simple-to-digest sugars with little real value for your body and are often considered as “bad”. Complex carbohydrates are considered “good”. They consist of longer series of sugars which takes the body more time to break down.
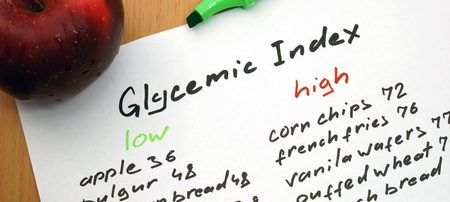
The glycemic index
Describing carbohydrates in simple or complex is one way to classify them. Another way to classify carbohydrates is by using “glycemic index”. The glycemic index ranks carbohydrates on a scale from 0 to 100 based on how rapidly and to what extent the carbohydrates raise your blood sugar levels after eating. Foods that have a high glycemic index are quickly digested and cause serious fluctuations in your blood sugar levels. Foods that have a low glycemic index are digested more gradually, bringing a more gradual rise in your blood sugar levels.
Important note
Remember that blood sugar levels have an impact on your energy, concentration, performance, mood, ability to lose weight and much more??? Keeping balanced blood sugar levels is highly important for a healthy working HPA axis and to restore adrenal health.
Index numbers for the low glycemic foods list PDF
Glycemic Index – Pay attention to those important numbers using the low glycemic foods list PDF.
The lower the number, the less of an impact the food has on your blood sugar:
55 or less = Low (good)
56- 69 = Medium
70 or higher = High (bad)
Blood Sugar & Adrenal Fatigue
A rapid rise in blood sugar levels by consuming large meals, simple carbohydrates or glycemically imbalanced meals can excessively elevate blood sugar levels. This causes the body to panic and overcompensate by releasing to much insulin. The insulin causes blood sugar levels to drop too low pushing the body (adrenal glands) to produce more cortisol to help restore blood sugar levels. When this pattern continues over time (years), it increases the risk of developing Adrenal Fatigue and other health conditions such as heart disease, diabetes, dementia and cancer. Maintaining a diet that helps keep your blood sugar levels stable is crucial to treating Adrenal Fatigue and preventing other health conditions. If you keep your blood sugar levels stable you will have more even energy levels, you will feel more satiated between meals and your cravings for unhealthy foods are reduced.
Lower your glycemic
Eating foods with a lower glycemic index may be beneficial for your health. It can help you live heart healthy, may lower the risk for developing diabetes and metabolic syndrome. It also may contribute to weight loss/maintenance by preventing spikes in your blood sugar and thus cut cravings and urges.
There is a time and place however for foods with a high glycemic index, as they can help re-fuel and maximize carbohydrate stores after exercise.
The Glycemic Load
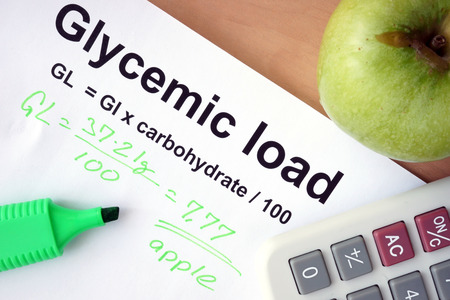
The glycemic load (GL) is a relatively new measurement to assess the impact of carbohydrate consumption on blood sugar levels. But it gives a more accurate picture than glycemic index alone. The GI does not show how high your blood sugar will go when you actually eat a particular food. That is obviously also determined by the AMOUNT of carbohydrate in a food. And to understand a food’s effect on blood sugar you need to know both. This is where “glycemic load” comes in.
Calculation
The glycemic load is calculated by multiplying the grams of a carbohydrate in a serving of food by the glycemic index and then dividing it by 100.
- a glycemic load of 10 or less is considered low;
- 11-19 is considered medium;
- 20 or above is considered high
Example
Watermelon has a high glycemic index (80). But there are not a lof ot carbohydrates in a serving of watermelon (6 grams). So the glycemic load is therefore only 5.
Factors Influencing Glycemic Response
The glycemic index is not cut-and-dry. First of all, the GI of a food can slightly vary from person to person. But there are other factors that influence your glycemic response. For instance your glycemic response to a food also depends on the other foods you eat with it. Consuming a food along with protein or fat slows the rate of stomach emptying and therefore foods are digested at a slower rate. Foods with acid content in them have a similar effect.
Fat and protein content
- Peanut M&M’s (GI=33)
- Jelly beans (GI=78)
- Potato chips (GI=54)
- Baked potato (GI=85)
Acid content
- Sourdough wheat bread (GI = 54)
- Wonder white bread (GI=73)
As you can see in the above examples in the case of m&m’s, potato chips and sourdough bread, the presence of protein, fat and acid content all reduce the food’s GI.
Glycemic Index & Glycemic Load Index For More Than 100 Foods
().
| FOOD |
Glycemic index (glucose = 100) |
Serving size (grams) |
Glycemic load per serving |
| BAKERY PRODUCTS AND BREADS |
|
|
|
| Banana cake, made with sugar |
47 |
60 |
14 |
| Banana cake, made without sugar |
55 |
60 |
12 |
| Sponge cake, plain |
46 |
63 |
17 |
| Vanilla cake made from packet mix with vanilla frosting (Betty Crocker) |
42 |
111 |
24 |
| Apple, made with sugar |
44 |
60 |
13 |
| Apple, made without sugar |
48 |
60 |
9 |
| Waffles, Aunt Jemima® (Quaker Oats) |
76 |
35 |
10 |
| Bagel, white, frozen |
72 |
70 |
25 |
| Baguette, white, plain |
95 |
30 |
15 |
| Coarse barley bread, 75-80% kernels, average |
34 |
30 |
7 |
| Hamburger bun |
61 |
30 |
9 |
| Kaiser roll |
73 |
30 |
12 |
| Pumpernickel bread |
56 |
30 |
7 |
| 50% cracked wheat kernel bread |
58 |
30 |
12 |
| White wheat flour bread |
71 |
30 |
10 |
| Wonder® bread, average |
73 |
30 |
10 |
| Whole wheat bread, average |
71 |
30 |
9 |
| 100% Whole Grain® bread (Natural Ovens) |
51 |
30 |
7 |
| Pita bread, white |
68 |
30 |
10 |
| Corn tortilla |
52 |
50 |
12 |
| Wheat tortilla |
30 |
50 |
8 |
| FOOD |
Glycemic index (glucose = 100) |
Serving size (grams) |
Glycemic load per serving |
| BEVERAGES |
| Coca Cola®, average |
63 |
250 mL |
16 |
| Fanta®, orange soft drink |
68 |
250 mL |
23 |
| Lucozade®, original (sparkling glucose drink) |
95 ±10 |
250 mL |
40 |
| Apple juice, unsweetened, average |
44 |
250 mL |
30 |
| Cranberry juice cocktail (Ocean Spray®) |
68 |
250 mL |
24 |
| Gatorade |
78 |
250 mL |
12 |
| Orange juice, unsweetened |
50 |
250 mL |
12 |
| Tomato juice, canned |
38 |
250 mL |
4 |
| FOOD |
Glycemic index (glucose = 100) |
Serving size (grams) |
Glycemic load per serving |
| BREAKFAST CEREALS AND RELATED PRODUCTS |
|
|
|
| All-Bran®, average |
55 |
30 |
12 |
| Coco Pops®, average |
77 |
30 |
20 |
| Cornflakes®, average |
93 |
30 |
23 |
| Cream of Wheat® (Nabisco) |
66 |
250 |
17 |
| Cream of Wheat®, Instant (Nabisco) |
74 |
250 |
22 |
| Grapenuts, average |
75 |
30 |
16 |
| Muesli, average |
66 |
30 |
16 |
| Oatmeal, average |
55 |
250 |
13 |
| Instant oatmeal, average |
83 |
250 |
30 |
| Puffed wheat, average |
80 |
30 |
17 |
| Raisin Bran® (Kellogg’s) |
61 |
30 |
12 |
| Special K® (Kellogg’s) |
69 |
30 |
14 |
| FOOD |
Glycemic index (glucose = 100) |
Serving size (grams) |
Glycemic load per serving |
| GRAINS |
|
|
|
| Pearled barley, average |
28 |
150 |
12 |
| Sweet corn on the cob, average |
60 |
150 |
20 |
| Couscous, average |
65 |
150 |
9 |
| Quinoa |
53 |
150 |
13 |
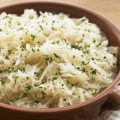
| White rice, average |
89 |
150 |
43 |
| Quick cooking white basmati |
67 |
150 |
28 |
| Brown rice, average |
50 |
150 |
16 |
| Converted, white rice (Uncle Ben’s®) |
38 |
150 |
14 |
| Whole wheat kernels, average |
30 |
50 |
11 |
| Bulgur, average |
48 |
150 |
12 |
| FOOD |
Glycemic index (glucose = 100) |
Serving size (grams) |
Glycemic load per serving |
| COOKIES AND CRACKERS |
|
|
|
| Graham crackers |
74 |
25 |
14 |
| Vanilla wafers |
77 |
25 |
14 |
| Shortbread |
64 |
25 |
10 |
| Rice cakes, average |
82 |
25 |
17 |
| Rye crisps, average |
64 |
25 |
11 |
| Soda crackers |
74 |
25 |
12 |
| FOOD |
Glycemic index (glucose = 100) |
Serving size (grams) |
Glycemic load per serving |
| DAIRY PRODUCTS AND ALTERNATIVES |
|
|
|
| Ice cream, regular |
57 |
50 |
6 |
| Ice cream, premium |
38 |
50 |
3 |
| Milk, full fat |
41 |
250mL |
5 |
| Milk, skim |
32 |
250 mL |
4 |
| Reduced-fat yogurt with fruit, average |
33 |
200 |
11 |
| FOOD |
Glycemic index (glucose = 100) |
Serving size (grams) |
Glycemic load per serving |
| FRUITS |
|
|
|
| Apple, average |
39 |
120 |
6 |
| Banana, ripe |
62 |
120 |
16 |
| Dates, dried |
42 |
60 |
18 |
| Grapefruit |
25 |
120 |
3 |
| Grapes, average |
59 |
120 |
11 |
| Orange, average |
40 |
120 |
4 |
| Peach, average |
42 |
120 |
5 |
| Peach, canned in light syrup |
40 |
120 |
5 |
| Pear, average |
38 |
120 |
4 |
| Pear, canned in pear juice |
43 |
120 |
5 |
| Prunes, pitted |
29 |
60 |
10 |
| Raisins |
64 |
60 |
28 |
| Watermelon |
72 |
120 |
4 |
| FOOD |
Glycemic index (glucose = 100) |
Serving size (grams) |
Glycemic load per serving |
| BEANS AND NUTS |
|
|
|
| Baked beans, average |
40 |
150 |
6 |
| Blackeye peas, average |
33 |
150 |
10 |
| Black beans |
30 |
150 |
7 |
| Chickpeas, average |
10 |
150 |
3 |
| Chickpeas, canned in brine |
38 |
150 |
9 |
| Navy beans, average |
31 |
150 |
9 |
| Kidney beans, average |
29 |
150 |
7 |
| Lentils, average |
29 |
150 |
5 |
| Soy beans, average |
15 |
150 |
1 |
| Cashews, salted |
27 |
50 |
3 |
| Peanuts, average |
7 |
50 |
0 |
| FOOD |
Glycemic index (glucose = 100) |
Serving size (grams) |
Glycemic load per serving |
| PASTA and NOODLES |
|
|
|
| Fettucini, average |
32 |
180 |
15 |
| Macaroni, average |
47 |
180 |
23 |
| Macaroni and Cheese (Kraft) |
64 |
180 |
32 |
| Spaghetti, white, boiled, average |
46 |
180 |
22 |
| Spaghetti, white, boiled 20 min, average |
58 |
180 |
26 |
| Spaghetti, wholemeal, boiled, average |
42 |
180 |
17 |
| FOOD |
Glycemic index (glucose = 100) |
Serving size (grams) |
Glycemic load per serving |
| SNACK FOODS |
|
|
|
| Corn chips, plain, salted, average |
42 |
50 |
11 |
| Fruit Roll-Ups® |
99 |
30 |
24 |
| M & M’s®, peanut |
33 |
30 |
6 |
| Microwave popcorn, plain, average |
55 |
20 |
6 |
| Potato chips, average |
51 |
50 |
12 |
| Pretzels, oven-baked |
83 |
30 |
16 |
| Snickers Bar® |
51 |
60 |
18 |
| FOOD |
Glycemic index (glucose = 100) |
Serving size (grams) |
Glycemic load per serving |
| VEGETABLES |
|
|
|
| Green peas, average |
51 |
80 |
4 |
| Carrots, average |
35 |
80 |
2 |
| Parsnips |
52 |
80 |
4 |
| Baked russet potato, average |
111 |
150 |
33 |
| Boiled white potato, average |
82 |
150 |
21 |
| Instant mashed potato, average |
87 |
150 |
17 |
| Sweet potato, average |
70 |
150 |
22 |
| Yam, average |
54 |
150 |
20 |
To summarize: low glycemic foods list PDF
- Low GI foods are great choice when battling Adrenal Fatigue as they provide natural, slowly released energy.
- In general, the less processed a carbohydrate, the more likely it is have a low glycemic index.
- Foods that are made with white flour and white sugar, including processed foods, tend to have a high glycemic index.
- There are several factors that influence your glycemic reponse to foods. For instance whether you eat a food in isolaton or as part of a meal.
- Eat a well-balanced diet that includes low glycemic index foods and as a guide for controlling portions you can use the glycemic load.
- See our diet page for more information about healthy eating.
If you want to learn more about the glycemic index, you can have a look at the glycemic index website from the University of Sydney. It provides extensive information and has a searchable database for GI values.
References & Further Reading